Martin De Wulf
Migrations Map
Interactive map
Visit the project
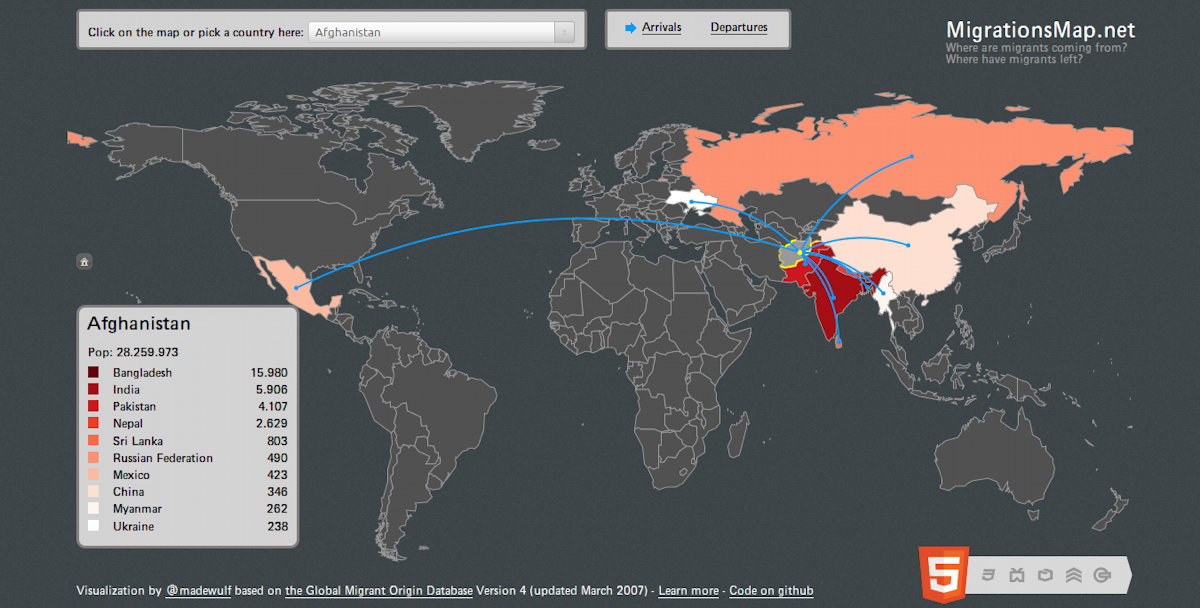
The map allows you to see for every country X in the world either the top ten providing countries of lifetime migrants to X or the top ten receiving countries of lifetime migrants from X. On top of that, when you let your mouse hover over a country, you can see the total population, the GDP per capita, the HIV and Tuberculosis prevalences and the death rate of children under five.
Martin De Wulf, born in 1978, have been programming this map to learn and have fun with HTML5 technologies. Besides of learning, my only goal is to create a website that can make people think.